Claim Variations dashboard
- See Navigating and Filtering Management Dashboards for clarification on how to customise the dashboard.
Dashboard overview
The six boxes across the top of the dashboard provide overview numbers for the estimates that fall within your selected filters.
Average Variance Line Item
This box displays the average variance per line item.

Average Gross Estimate Amount
This box displays the average gross amount of all estimates selected by your filters.

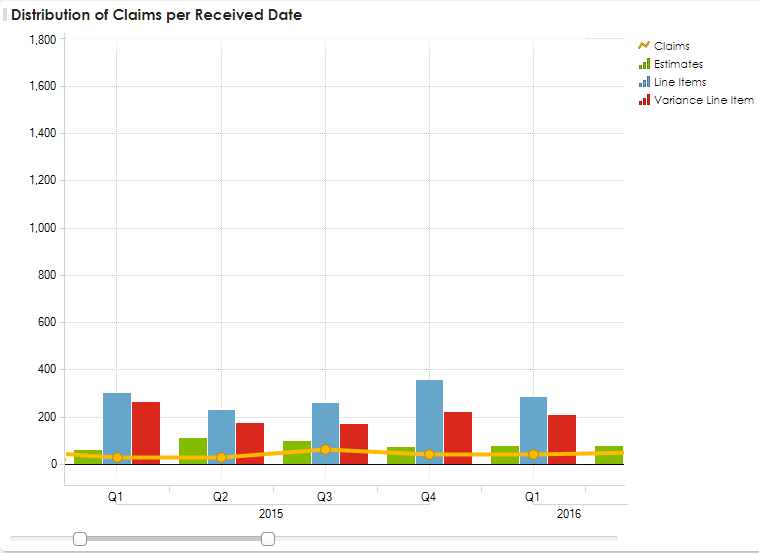
Distribution of Claims per Received Date
This bar chart provides visual representation of the distribution of claims per received date. Hover over a bar for more details.

Distribution of File Statuses across Counts for Line Items & Variances per Gross Estimate Ranges
This distribution graph outlines the distribution of file statuses across counts for line items and variances per Gross Estimate Ranges by Closed, Open, and Re-Opened statuses. Hover over a file status for additional information.

Number of Variance Line Item per Type of Loss
This bar chart displays the number of variance per type of loss. Each loss type is delineated by a colour (see the legend to the right). Hover over a bar for additional details.

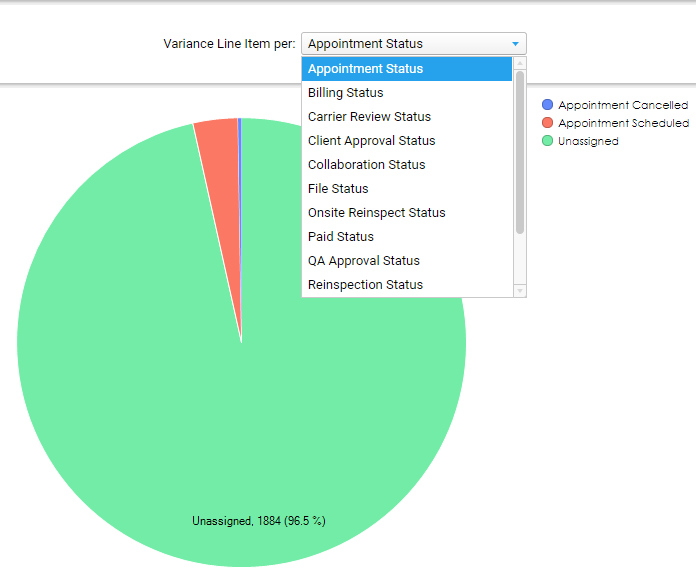
Variance Line Item per Status
This pie chart shows variance per various statuses. Select a type of status to view from the list.

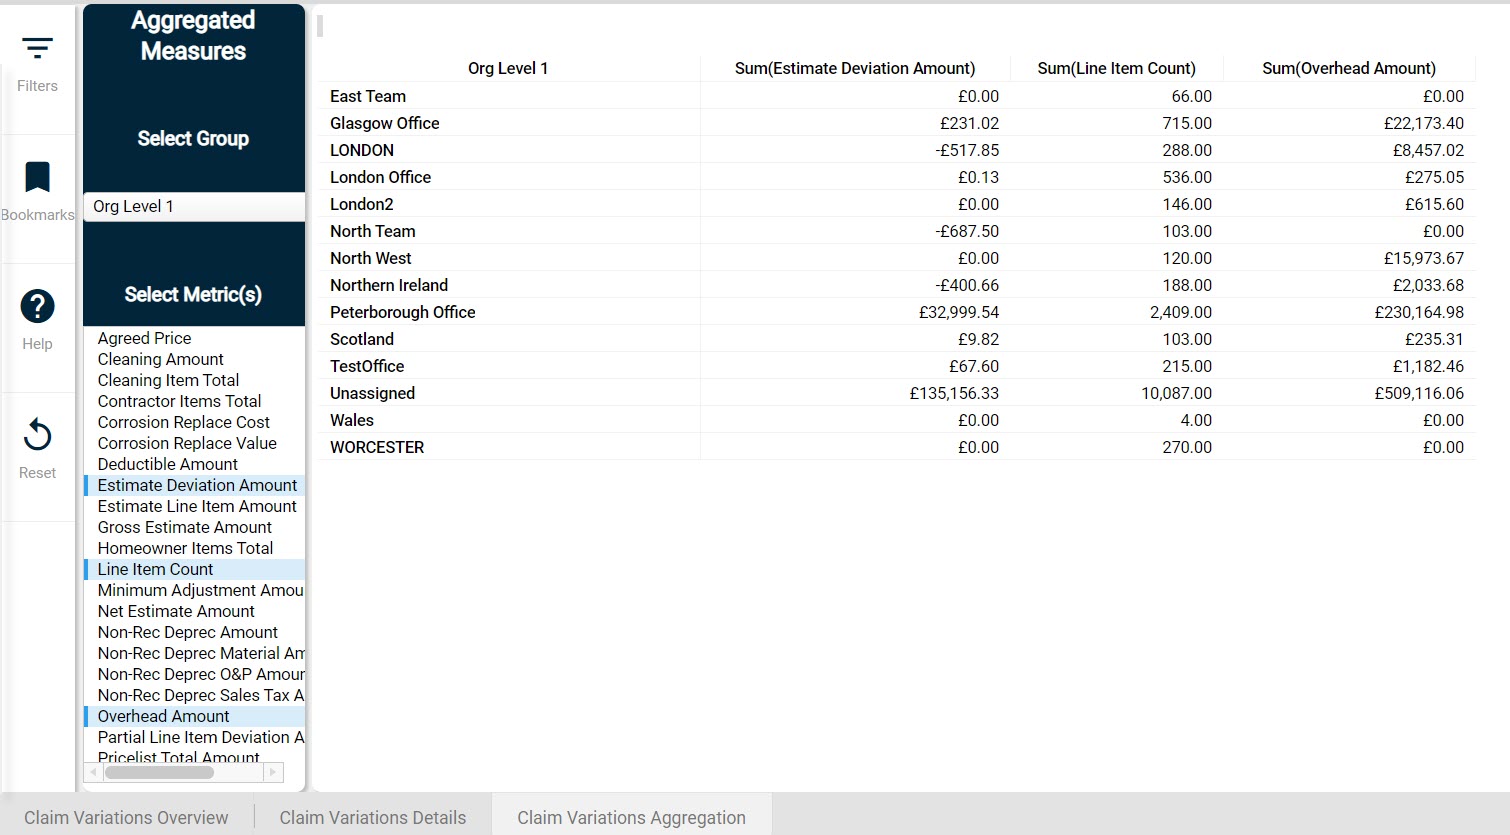
Claim Variations Aggregation tab
You can group different metrics together in reports.
In the Aggregated Measures page, select a group.
Select metric(s). You can select multiple options in a filter by holding Ctrl on your keyboard whilst you click on each option.

Send us feedback on this article
Copyright © 2005-2021 Xactware Solutions, Inc. All rights reserved.